Fitting 2D data
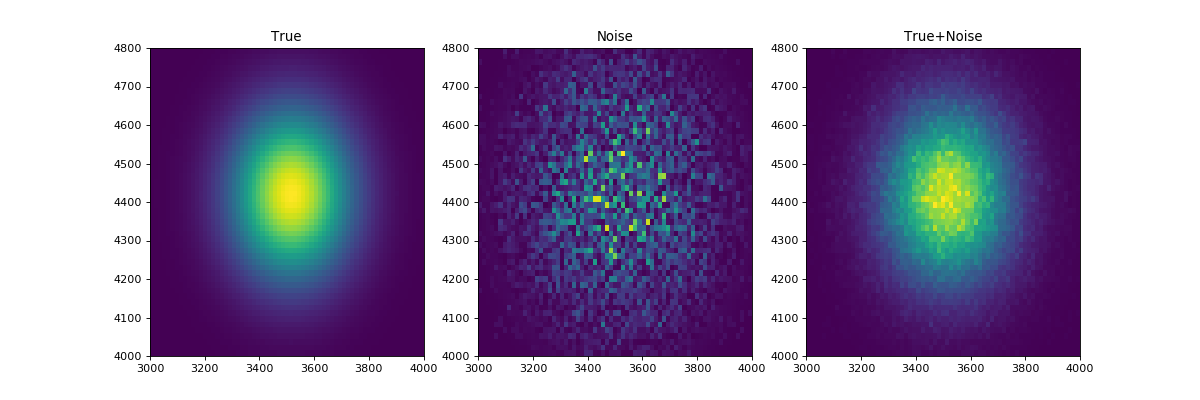
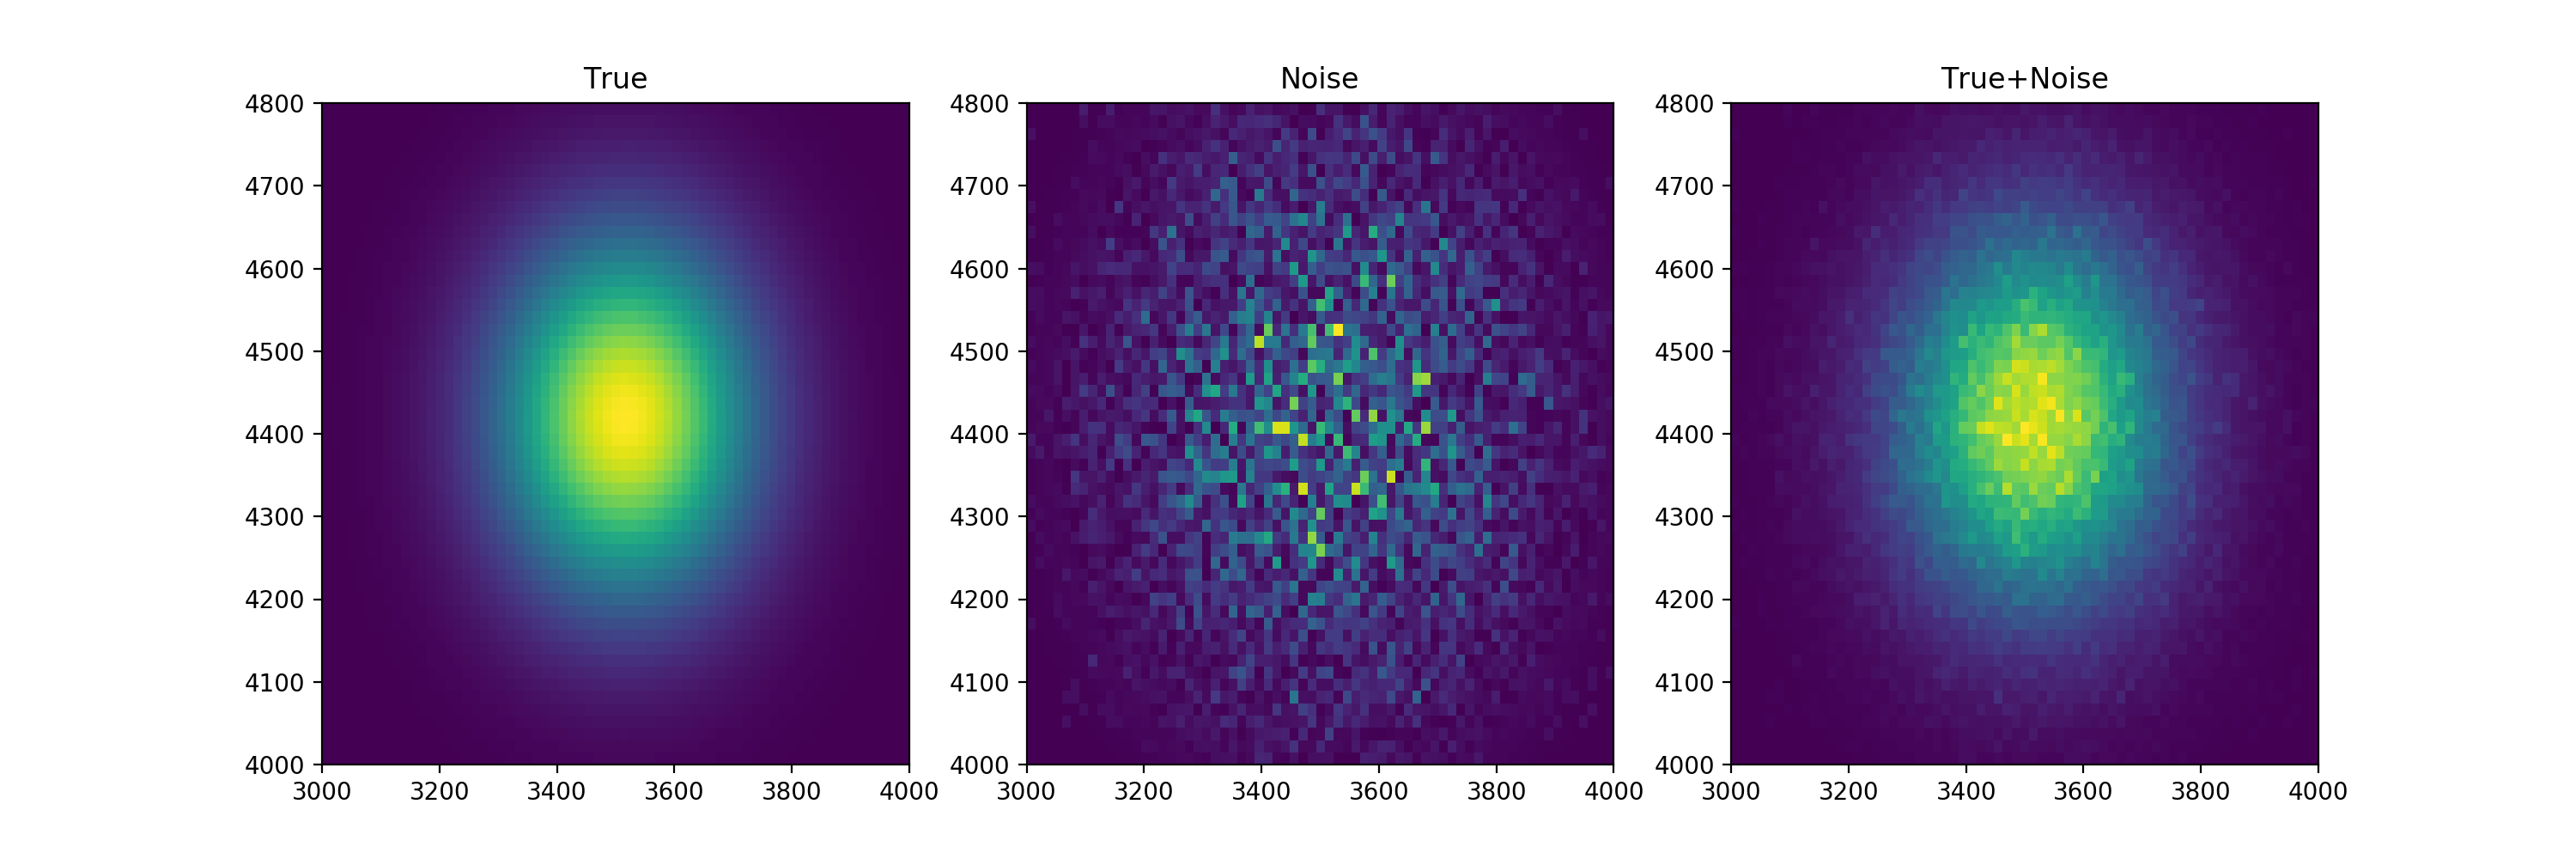
We need to define some data so we use the Gaussian2D model and add some poisson noise:
from saba import SherpaFitter
from astropy.modeling.models import Gaussian2D
import numpy as np

np.random.seed(123456789)
x0low, x0high = 3000, 4000
x1low, x1high = 4000, 4800
dx = 15
x1, x0 = np.mgrid[x1low:x1high:dx, x0low:x0high:dx]
shape = x0.shape
x0, x1 = x0.flatten(), x1.flatten()

truth = Gaussian2D(x_mean=3512, y_mean=4418, x_stddev=150, y_stddev=150,
                   theta=20, amplitude=100)

mexp = truth(x0, x1).reshape(shape)
merr = np.abs(np.random.poisson(mexp) - mexp)

plt.rcParams['figure.figsize'] = (15, 5)
plt.subplot(1, 3, 1)
plt.imshow(mexp, origin='lower', cmap='viridis',
           extent=(x0low, x0high, x1low, x1high),
           interpolation='nearest', aspect='auto')
plt.title("True")
plt.subplot(1, 3, 2)
plt.imshow(merr, origin='lower', cmap='viridis',
           extent=(x0low, x0high, x1low, x1high),
           interpolation='nearest', aspect='auto')
plt.title("Noise")
plt.subplot(1, 3, 3)
plt.imshow((mexp + merr), origin='lower', cmap='viridis',
           extent=(x0low, x0high, x1low, x1high),
           interpolation='nearest', aspect='auto')
plt.title("True+Noise")
(Source code, png, hires.png, pdf)

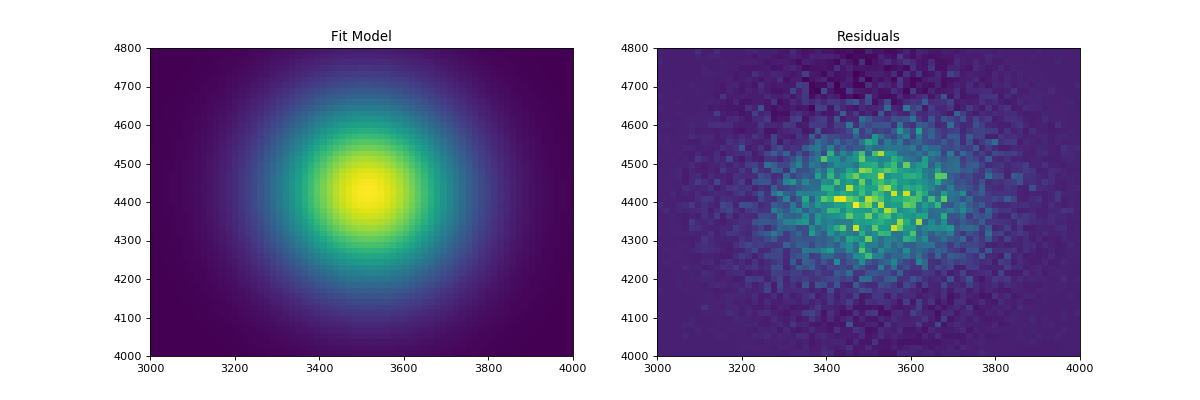
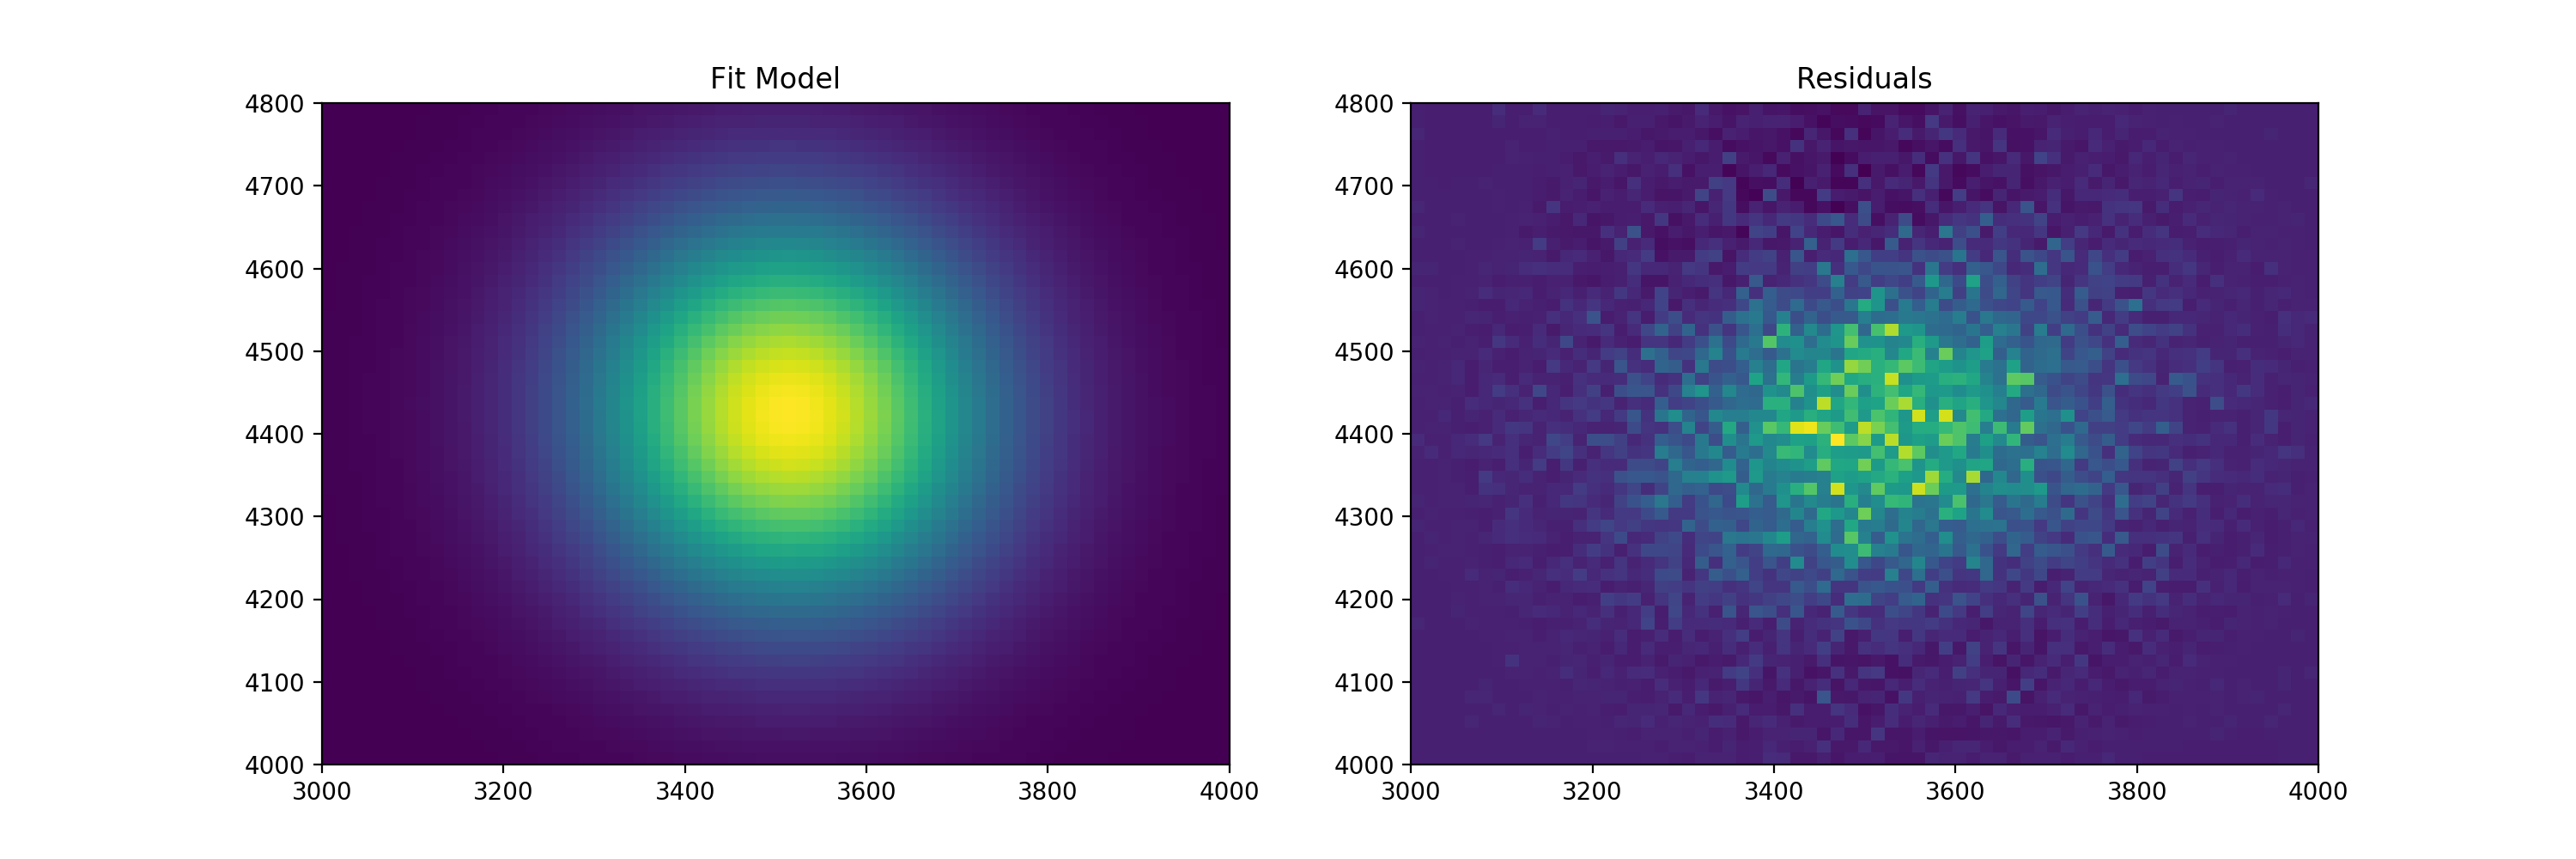
Now we have some data so let’s fit a model after the parameters have been offset. Here we flatten the arrays and then adjust the error bars for the fit:
sfit = SherpaFitter(statistic="chi2")
fitmo = truth.copy()
fitmo.x_mean = 3650
fitmo.y_mean = 4250
fitmo.x_stddev = 100
fitmo.y_stddev = 100
fitmo.theta = 10
fitmo.amplitude = 50

fitmo = sfit(fitmo, x=x0.flatten(), y=x1.flatten(), z=mexp.flatten()+merr.flatten(),
             err=merr.flatten()+np.random.uniform(-0.5,0.5,x0.size))

plt.subplot(1, 2, 1)
plt.imshow(fitmo(x0, x1).reshape(shape), origin='lower', cmap='viridis',
           extent=(x0low, x0high, x1low, x1high),
           interpolation='nearest', aspect='auto')
plt.title("Fit Model")

res = (mexp + merr) - fitmo(x0, x1).reshape(shape)
plt.subplot(1, 2, 2)
plt.imshow(res, origin='lower', cmap='viridis',
           extent=(x0low, x0high, x1low, x1high),
           interpolation='nearest', aspect='auto')
plt.title("Residuals")
(Source code, png, hires.png, pdf)
